


Bigger Houses, Smaller Lots: Trends Over Time Detached Homes in the City of Courtenay
How big a house fits our idea of what a single-family detached house should be?
And how much land should come with that home?
Does it feel like as the years pass by, the lot sizes are shrinking and house sizes are growing? That feeling is backed up with facts.
Our office is located in the City of Courtenay on Vancouver Island, so we did some research with help from datasets provided by the Landcor Data Corporation.
In Courtenay, the relationship between lot size and house size looks quite different depending on when a house was built.
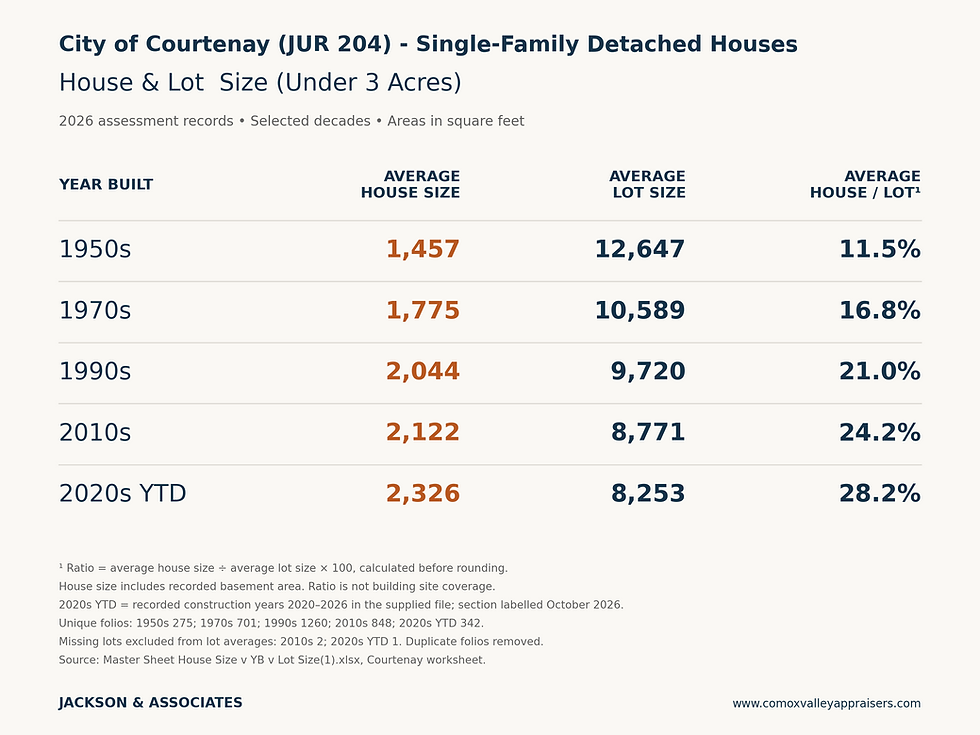
Jackson & Associates’ analysis of the data for single-family detached houses reveals a clear pattern across the selected construction decades: newer homes generally have more floor area and occupy smaller lots.
For property owners, buyers and lenders, that raises an appraisal question: how does the balance between house and land influence value?
The numbers tell the story. Courtenay houses built in the 1950s average 1,457 square feet, with average lots of 12,647 square feet. For houses built in the 2020s through the supplied October 2026 dataset, average house size reaches 2,326 square feet, while average lot size falls to 8,253 square feet.
Using rounded figures, that represents approximately 60% more house: (2,326 ÷ 1,457 − 1) × 100. Average lot area is approximately 35% smaller: (8,253 ÷ 12,647 − 1) × 100.
The intervening decades reinforce the pattern. Average house sizes increase from 1,775 square feet for the 1970s to 2,044 for the 1990s and 2,122 for the 2010s.
Average lot sizes decline across those same groups, from 10,589 to 9,720 and then 8,771 square feet.
Another way to express the change is to divide average house area by average lot area. That relationship rises from 11.5% for the 1950s group to 28.2% for the 2020s group.
However, this is not a measure of building coverage. The house figures include recorded basement floor area, and a home’s total floor area differs from its footprint. The ratio illustrates the changing balance between recorded interior space and land area; it does not establish how much of a lot is physically covered by buildings.

From an appraisal perspective, the first implication is straightforward: construction decade alone is not enough to identify a comparable property.
A 1950s house on a large lot and a newer house on a compact lot may serve different buyer preferences, even within the same municipality. A meaningful comparison considers location, condition, layout, usable floor area, site utility and other relevant characteristics together. Simply comparing sale prices per square foot can obscure those differences.
The second implication is that additional land does not necessarily contribute value at a constant rate.
Consider two otherwise similar properties, one with an 8,000-square-foot lot and another with 12,000 square feet. The larger property has 50% more land, but that does not establish a 50% land-value premium.
The contribution of the additional area depends on its usefulness and what purchasers demonstrate they will pay for it.
Privacy, gardening space, outdoor recreation, access and parking may matter.
Conversely, steep slopes, awkward configuration or other limitations may reduce the utility of additional land. Any potential for subdivision or additional housing requires property-specific investigation, including planning and servicing verification.
The same principle applies to house size. More square footage can offer additional bedrooms, workspace or flexibility, but size is not a substitute for functionality. A well-designed smaller home may compete favourably with a larger home that has an inefficient layout or substantial renovation requirements. Appraisal adjustments should reflect market evidence rather than an assumed dollar amount for every additional square foot.
Smaller lots also invite consideration of trade-offs. Some purchasers may prefer less yard maintenance; others may place greater weight on separation from neighbours or outdoor space. These are potential explanations for differing preferences, not conclusions established by this dataset. Sales evidence is needed to determine how those preferences affect prices.
There is also an important distinction between observing a pattern and explaining its cause. Land costs, development economics, planning requirements and household preferences are possible influences worth investigating. The assessment records alone do not isolate their effects.
Nor does this table track the same properties over time. It compares homes grouped by original construction year within the supplied records. Renovations, additions, redevelopment and the mix of neighbourhoods represented can influence the results. Averages also conceal variation within each decade.
At Jackson & Associates, we see the value of this analysis in the questions it helps us ask. How much usable house does a purchaser receive? What does the lot contribute? How does the combination compare with competing properties?
Courtenay’s newer detached homes in this dataset offer more interior space on less land. Understanding what that combination is worth requires local knowledge, careful comparison and property-specific analysis.
Source: Supplied 2026 Courtenay assessment dataset rom LANDCOR DATA CORPORATION; duplicate folios removed and missing lot areas excluded from lot averages.


Comments